The age-crime curve and the crime drop in (some of) Northern Europe
6/28/23
Before we begin
- This is extremely work-in-progress!
- Any and all comments much appreciated
Background
We can analyse change in the demographics of crime to refine theories of the crime drop, some explanations for the crime drop fit better with period effects (implying a reasonably uniform change across age?) (Kim, Bushway, and Tsao 2016)
Change in the age-crime curve (e.g. the debate over the ‘invariance’ of the shape of the age-crime curve) is also interesting for developmental criminologists (Hirschi and Gottfredson 1983; Farrington 1986)
Background
Some evidence that the ‘youth crime drop’ differs in magnitude between countries (Matthews and Minton 2018; Sivertsson, Nilsson, and Bäckman 2021; Farrell, Laycock, and Tilley 2015)
But in general there are questions about how exactly ‘international’ the international crime drop is (Kotzé 2019)
But no (as far as I’m aware) systematic international comparison about how the demographics of crime have changed over the course of the crime drop
Research Design
Aim: compare changing age-crime curves across Northern Europe
Why Northern Europe? Basically data availability
In the future - possibly extend this analysis to include other countries where data are available
Expanding the international scope could help contextualize other findings from studies using register data?
Research Design
Problem: little data available at year-of-age level, no guarantee that the same age-groups are used in different countries
Solution: use
Penalized Composite Link Modelto construct smooth age-year-conviction surfaces from publicly available data
Data
Total conviction numbers by age for Scotland, Norway, Finland and Denmark
Also available by sex (but not analysed separately here due to time constraints)
Time periods covered:
- Scotland: 1990-2018
- Norway: 2002-2021
- Finland: 1990-2021
- Denmark: 1980-2021
No data (that I could find) for Sweden or the Netherlands!
Data
Age bands used:
Scotland: single year of age (!) from age 12
Norway: 15-17; 18-20; 21-24; 25-29; 30-39; 40-49; 50-59; >=60
Finland: 15-17; 18-20; 21-24; 25-29; 30-39; 40-49; 50-59; 60-69; 70-79; >=80
Denmark: 15-24 single year of age; 25-29; 30-39; 40-49; 50-59; 60-69; 70-79; >=80
Data sources
Scotland: Data behind an interactive web app
Finland: Statistics Finland
Denmark: Statistics Denmark
Norway: Statistics Norway
The same sources provided population data as well as conviction data
Measures
- Prevalence (people convicted) or incidence (total convictions)?
- Scotland is incidence (“Convictions”)
- Norway is incidence (“sanctions”)
- Finland I think is prevalence (“Convicted, number”)
- Denmark is incidence (“Convictions”) - although there is a separate statistical return for prevalence!
Measures
- All crime types?
- Yes. At least this is… less controversially comparable (at least after standardizing within country?)
- All sanctions?
- In Norway I removed on the spot fines because that’s what SSB (sometimes?) do (and the age-crime curve looked very odd if I didn’t) otherwise yes
Methods
Used
Rimplementation of Penalized Composite Link Model (PCLM) using the packageungroup(Pascariu et al. 2018)Because PCLM models convictions data and population data together to estimate a smooth surface of conviction rates, so you probably shouldn’t look for disruptions in the time series (policy shocks or what have you)
But you can look at overall trends
Methods
- Measure conviction rates as:
- Crude rates
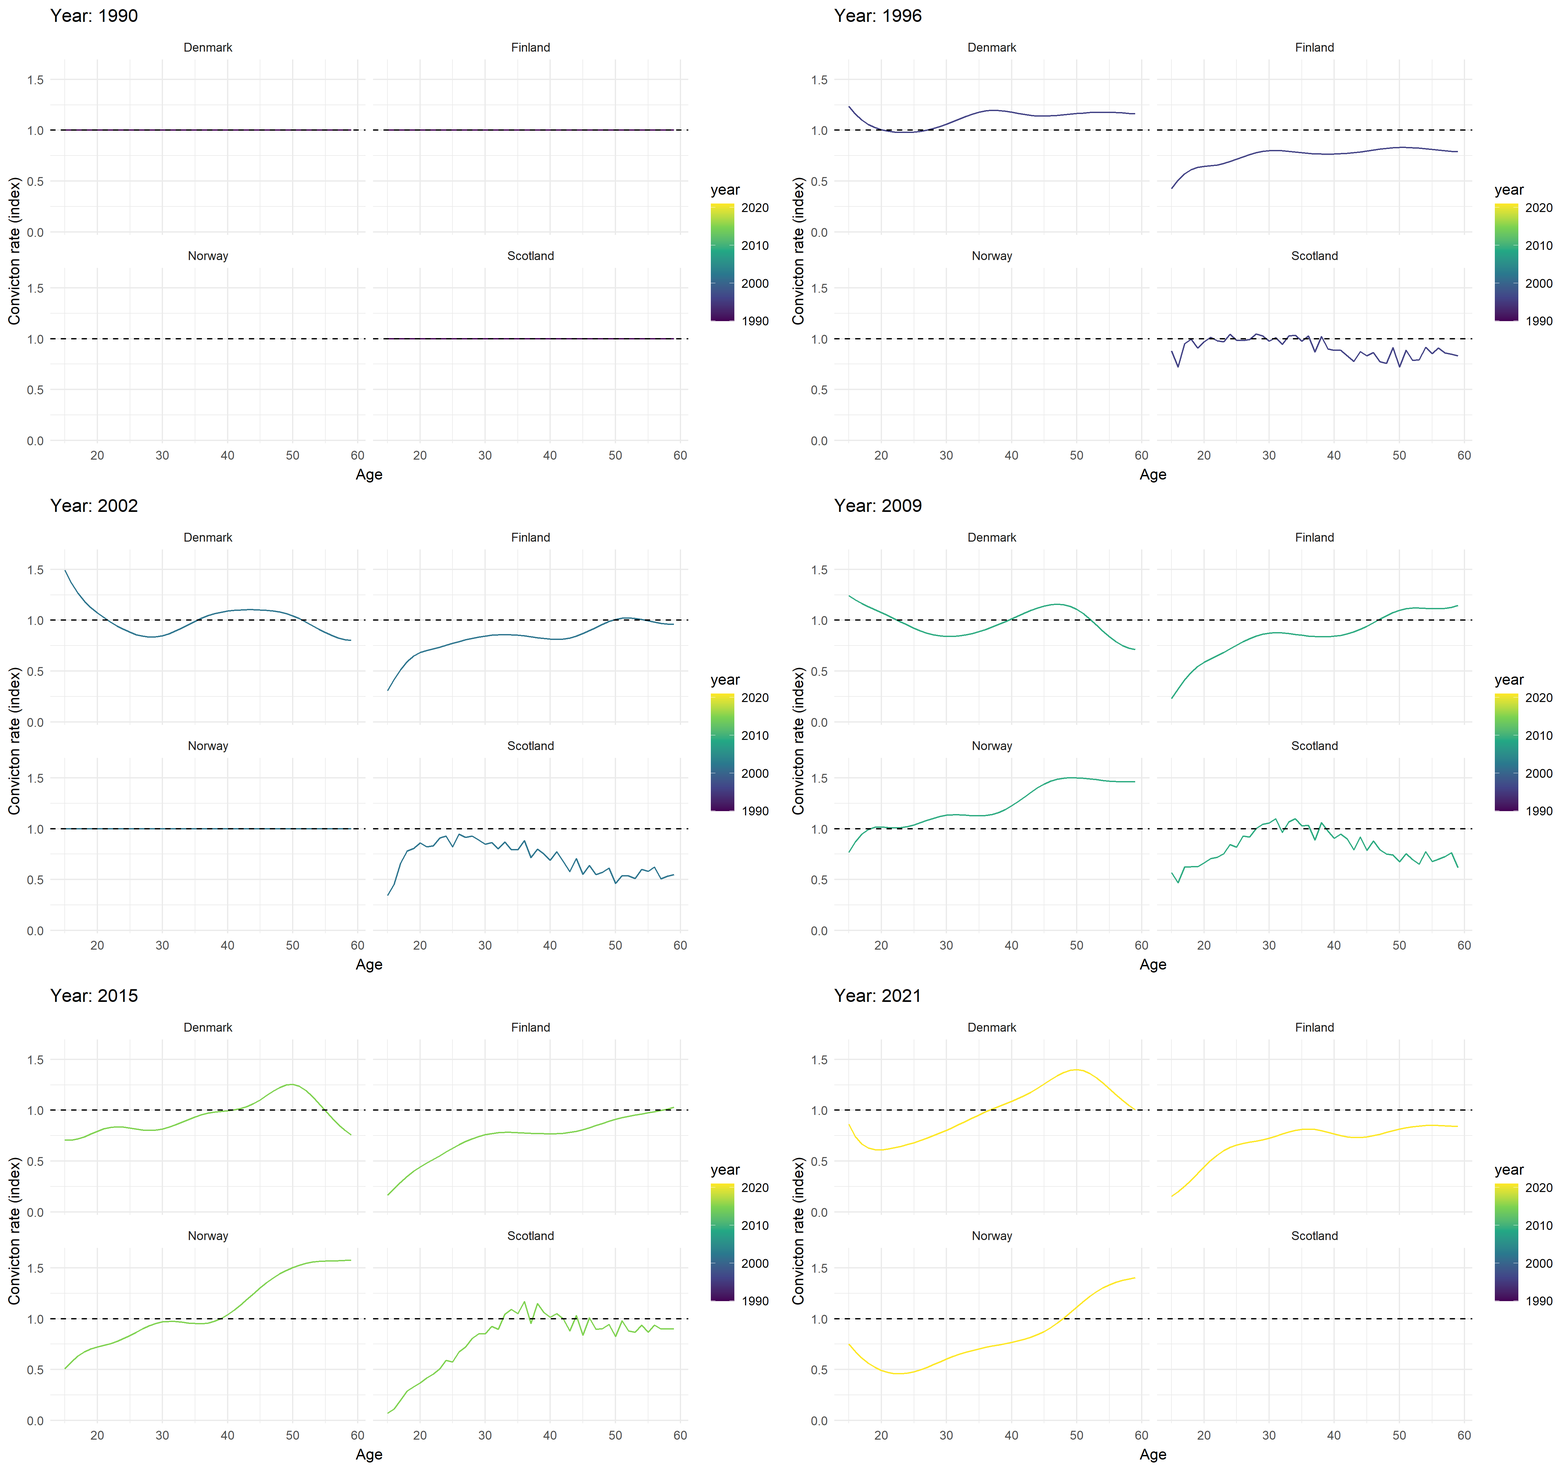
- Country standardized rates (divide the conviction rate for each age-year by the maximum single-age conviction rate for that country)
- Country-year standardized rates (divide the conviction rate for each age-year by the maximum single-age conviction rate for that country in that year)
Research questions
- How (qualitatively) similar is the change in the age-crime curve between countries?
- How much (qualitatively) does the age-crime curve change within countries over time?
Analytical plan
- Look at the results visually as a series of line charts and on the Lexis surface (Minton 2020)
- Calculate relevant summary statistics (mode, median, mean age of conviction)
- In the future - possibly bespoke models and visualizations for comparing Lexis surfaces (Acosta and Raalte 2019)?
- Although visual analysis tends to give the same results as formal modelling (Jones, Minton, and Bell 2023)
Results
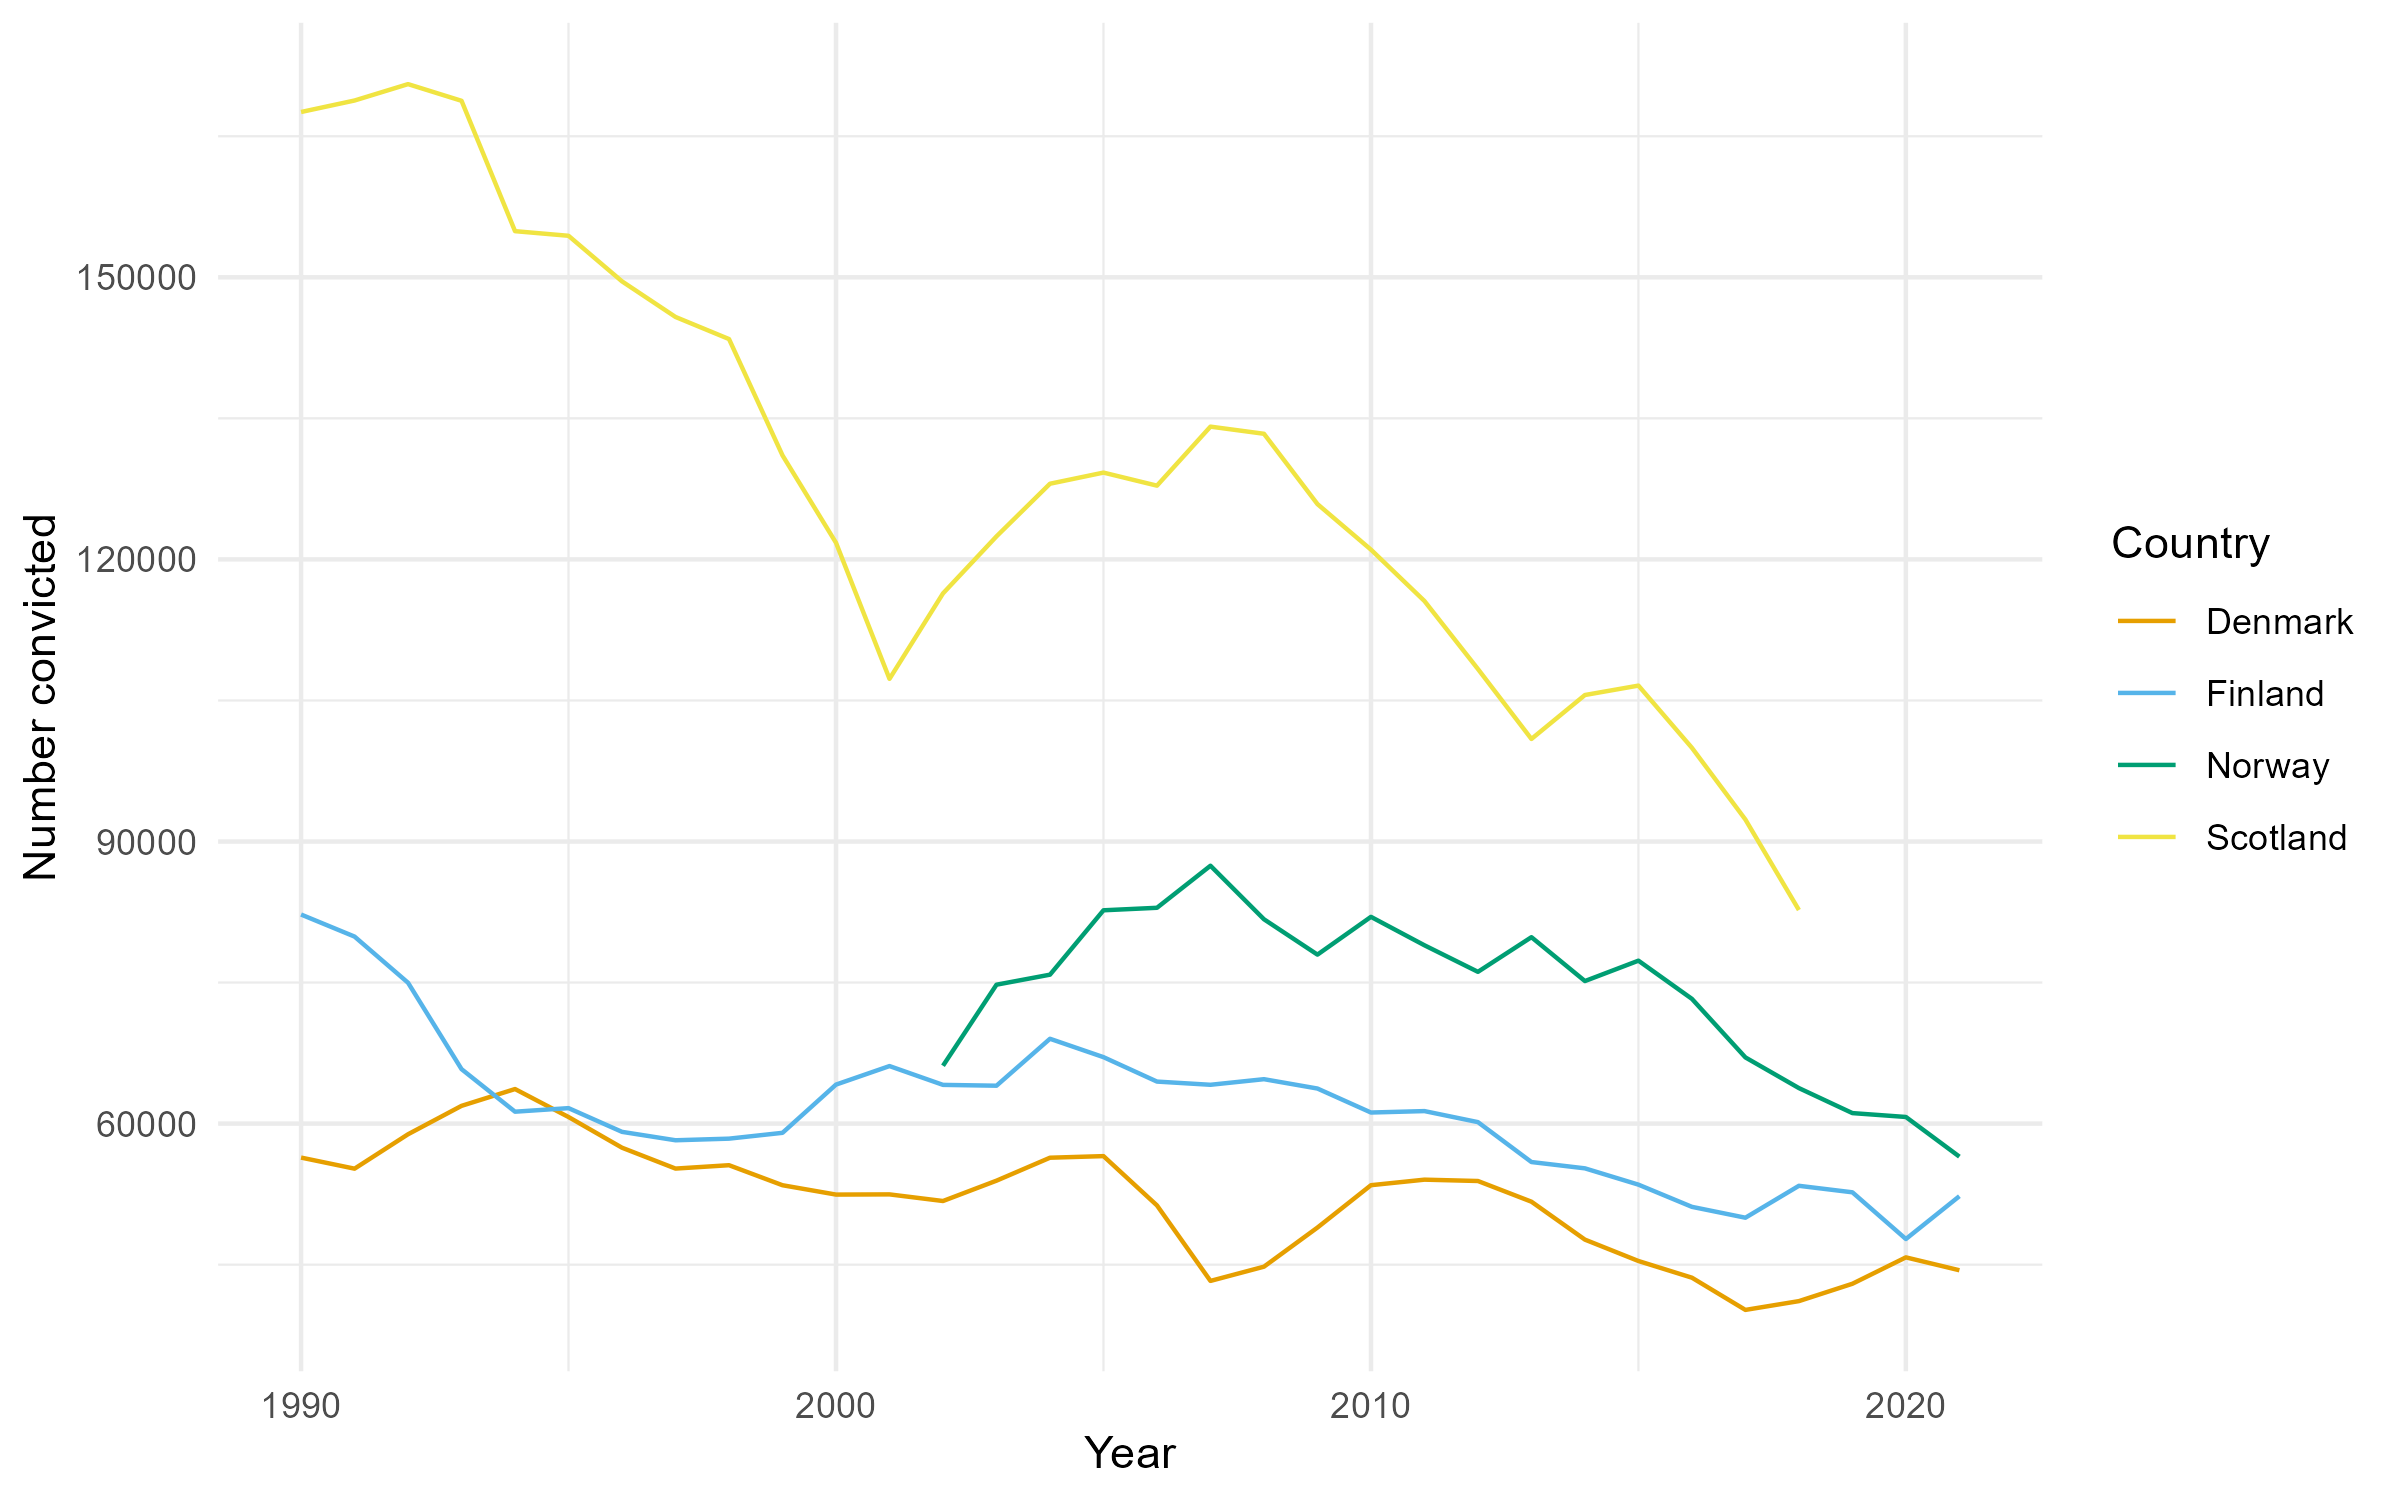
Overall conviction numbers
Comparing countries 1
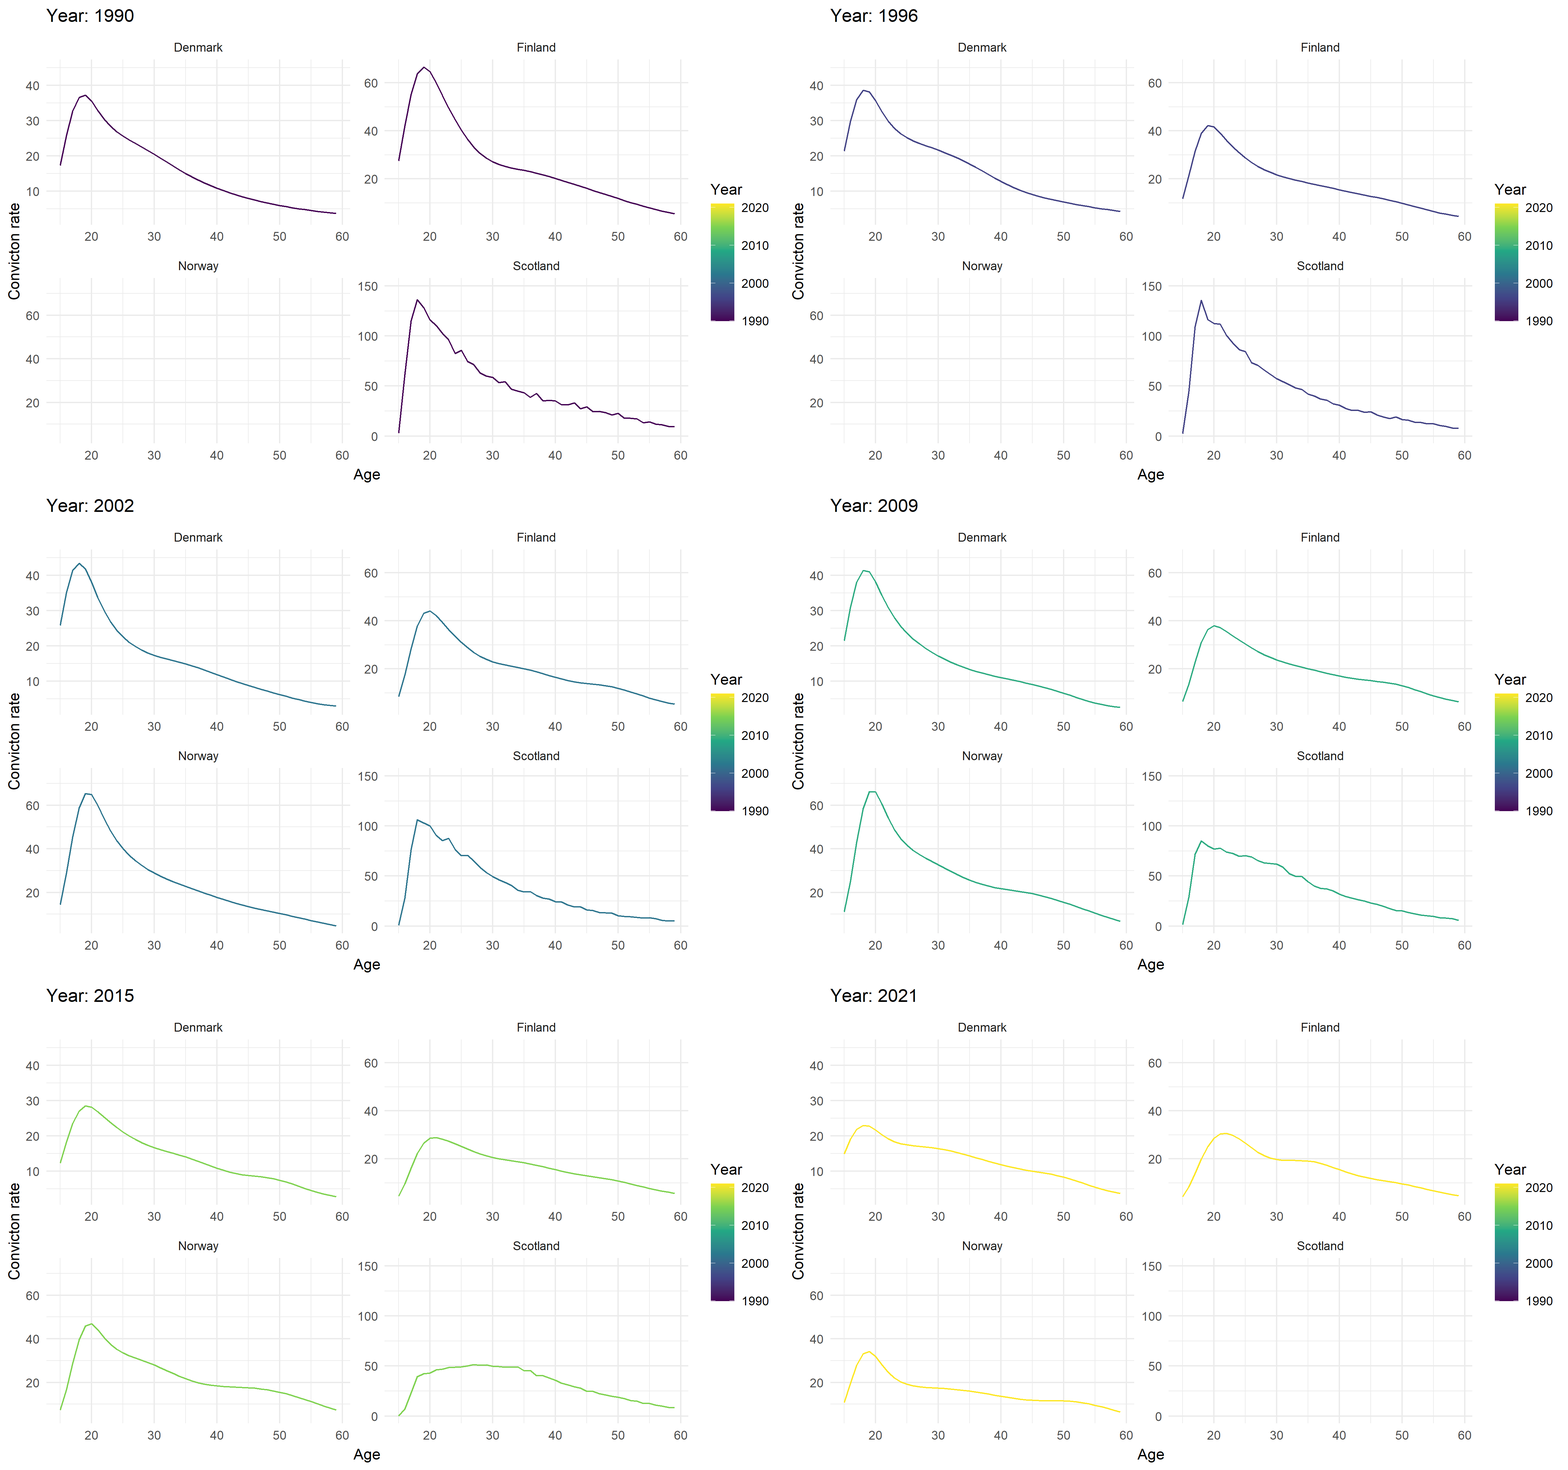
Age-crime curves in Northern Europe
Comparing countries 2
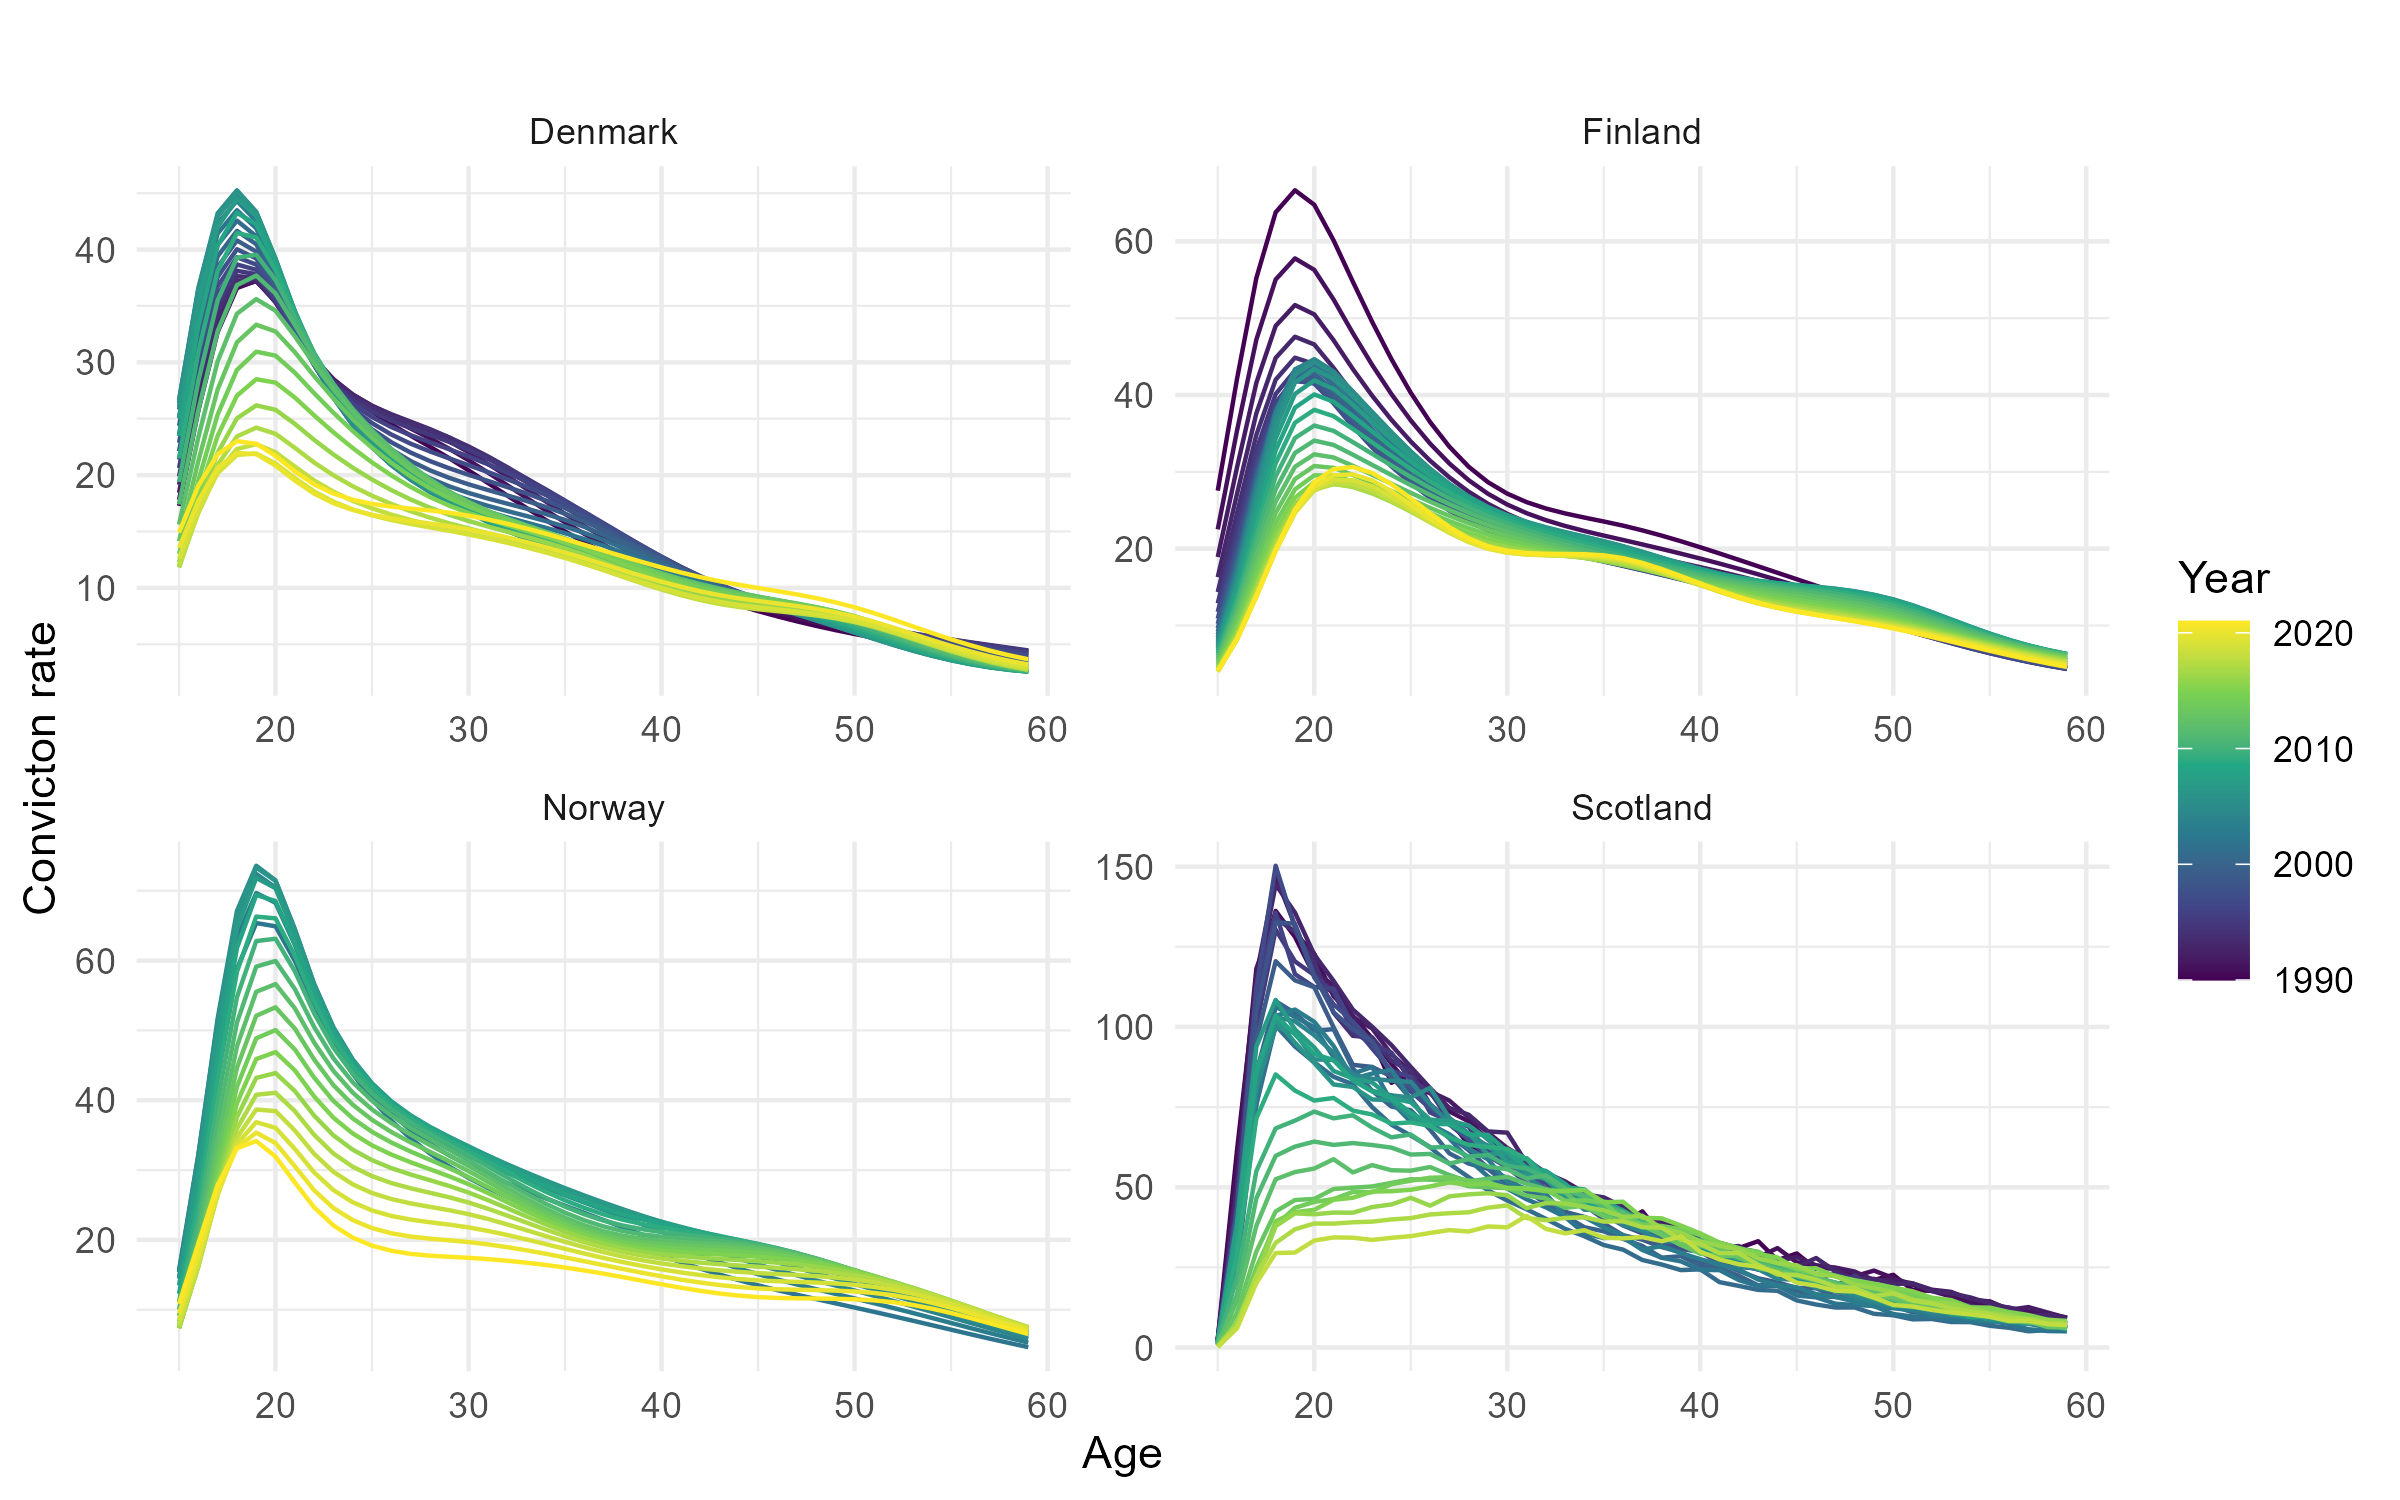
Age-crime curves in Northern Europe (again)
Comparing countries 3
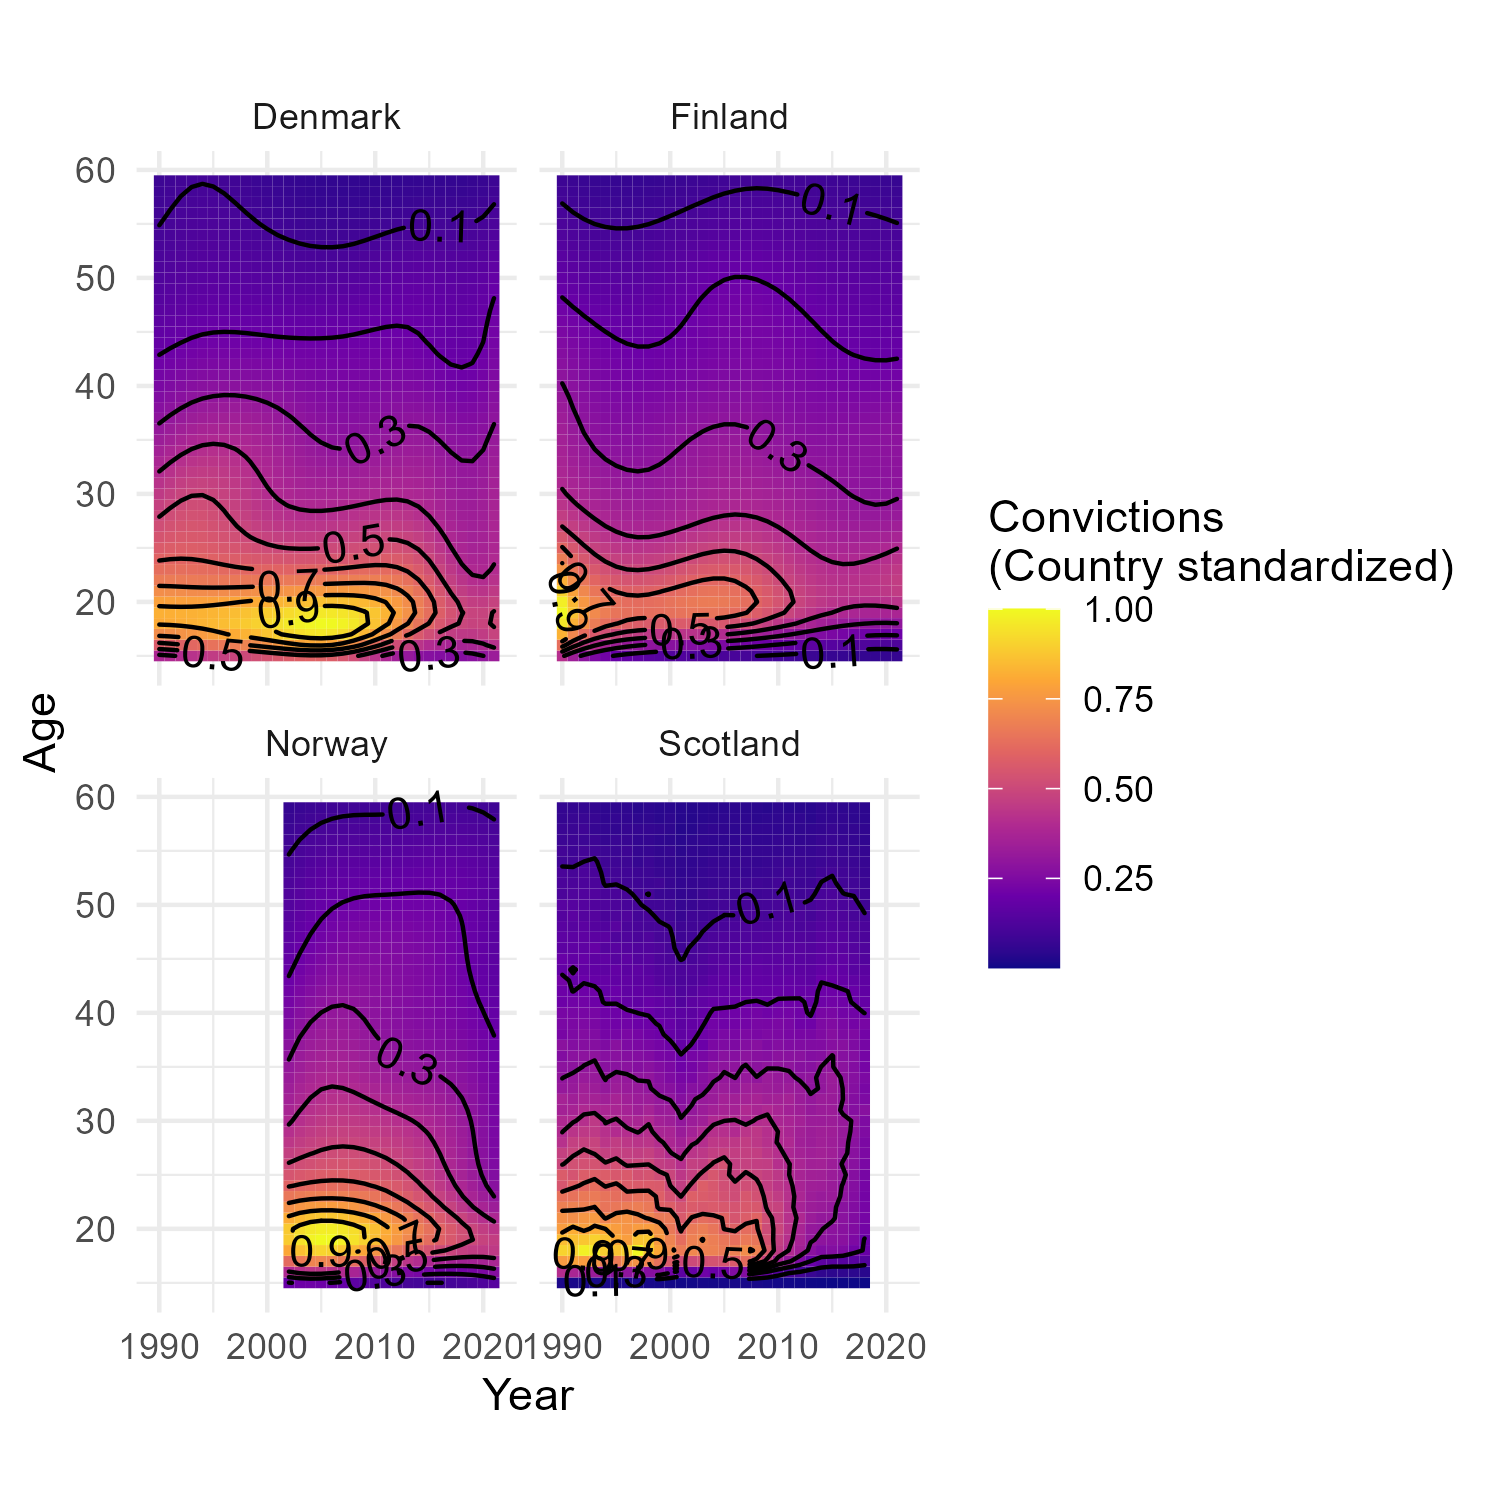
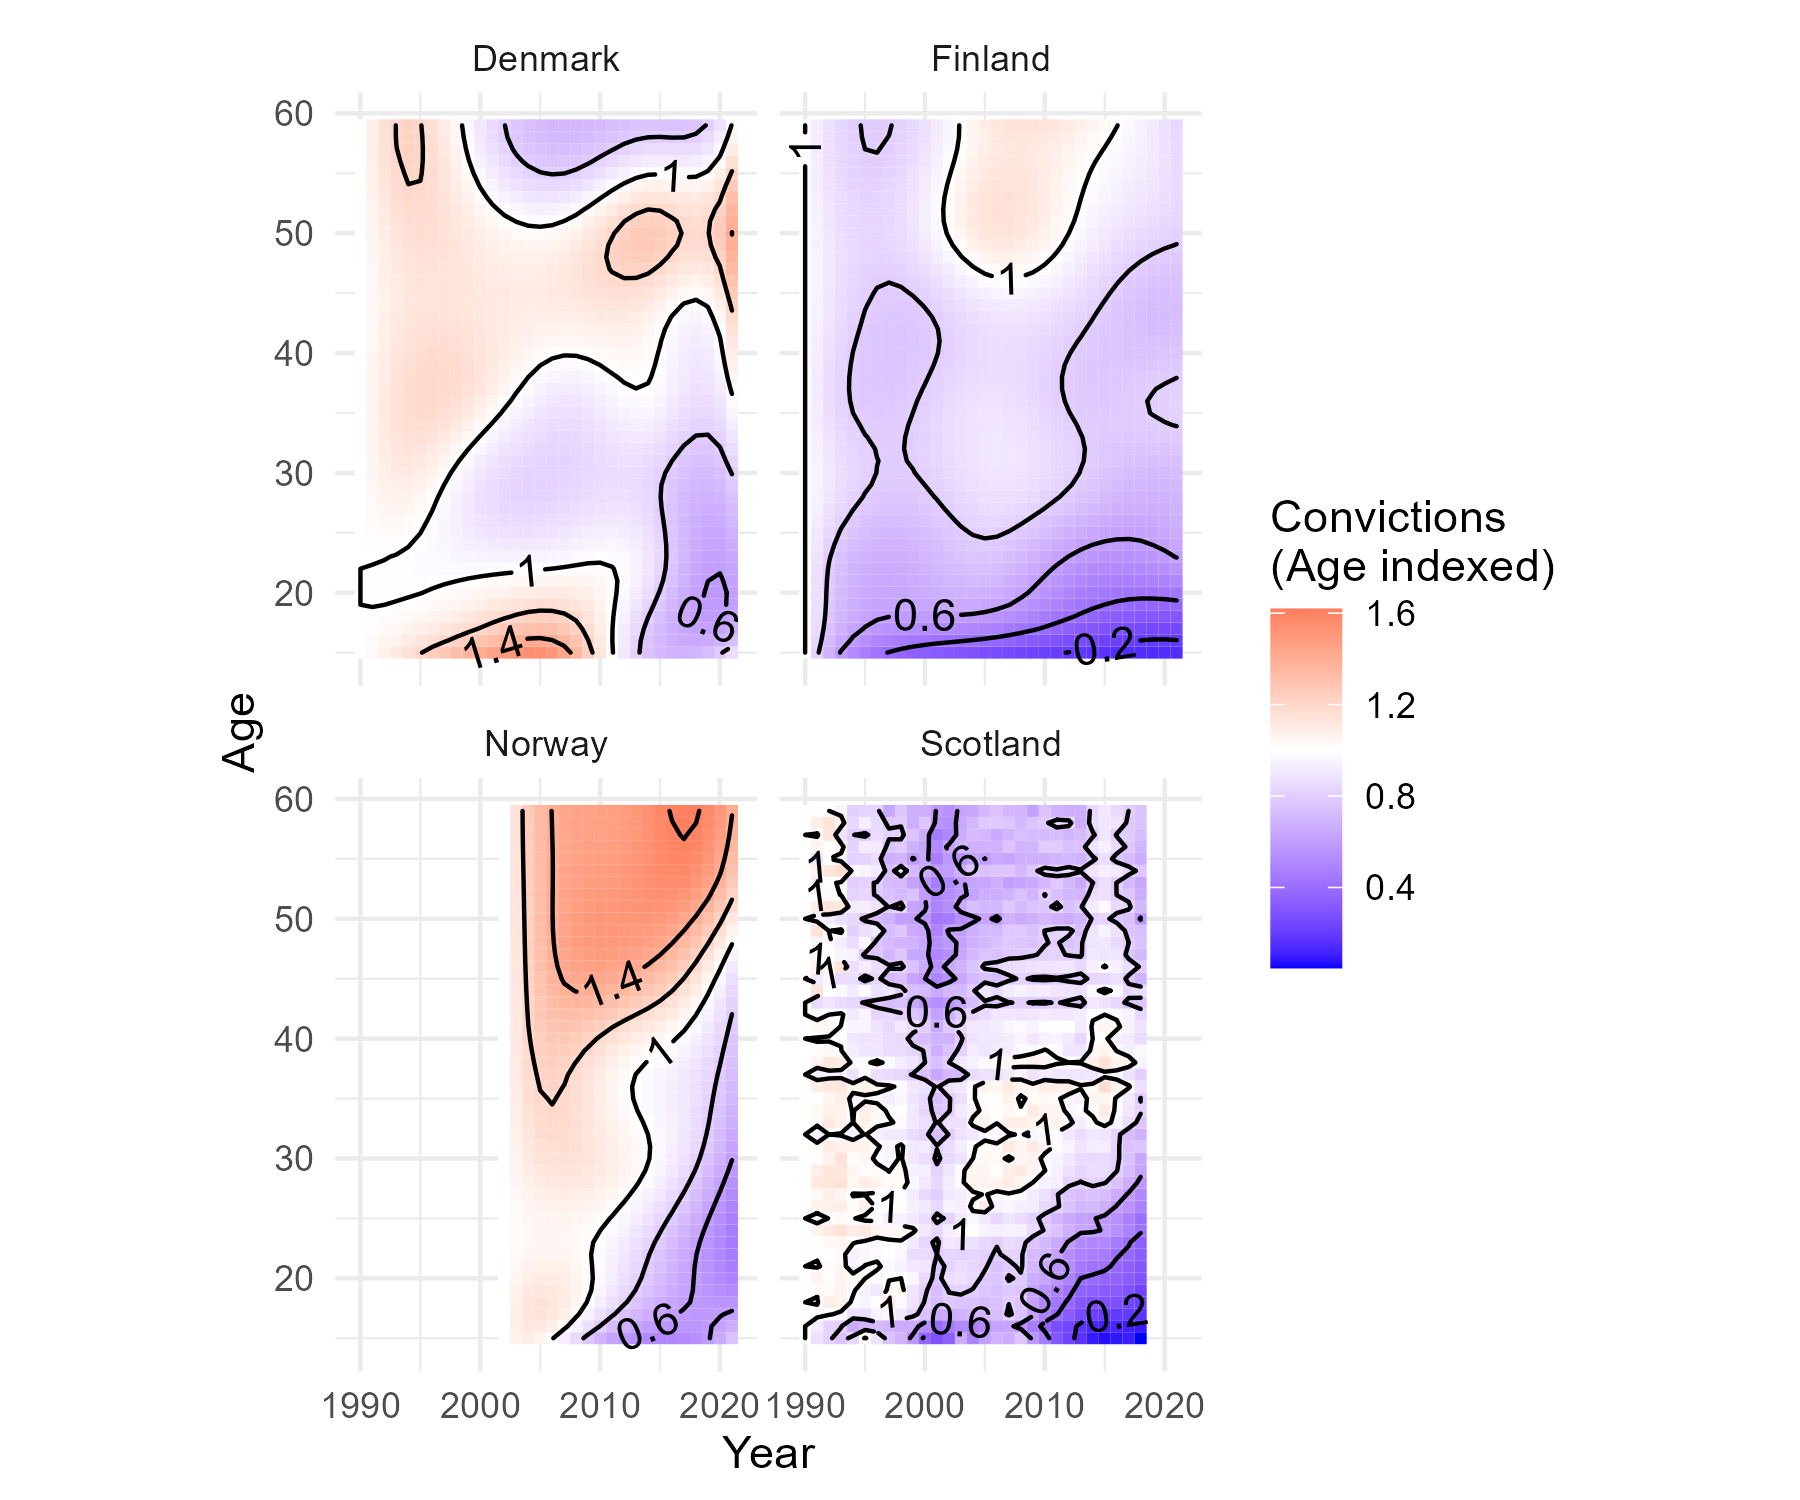
Age-crime surfaces in Northern Europe
Comparing countries 4
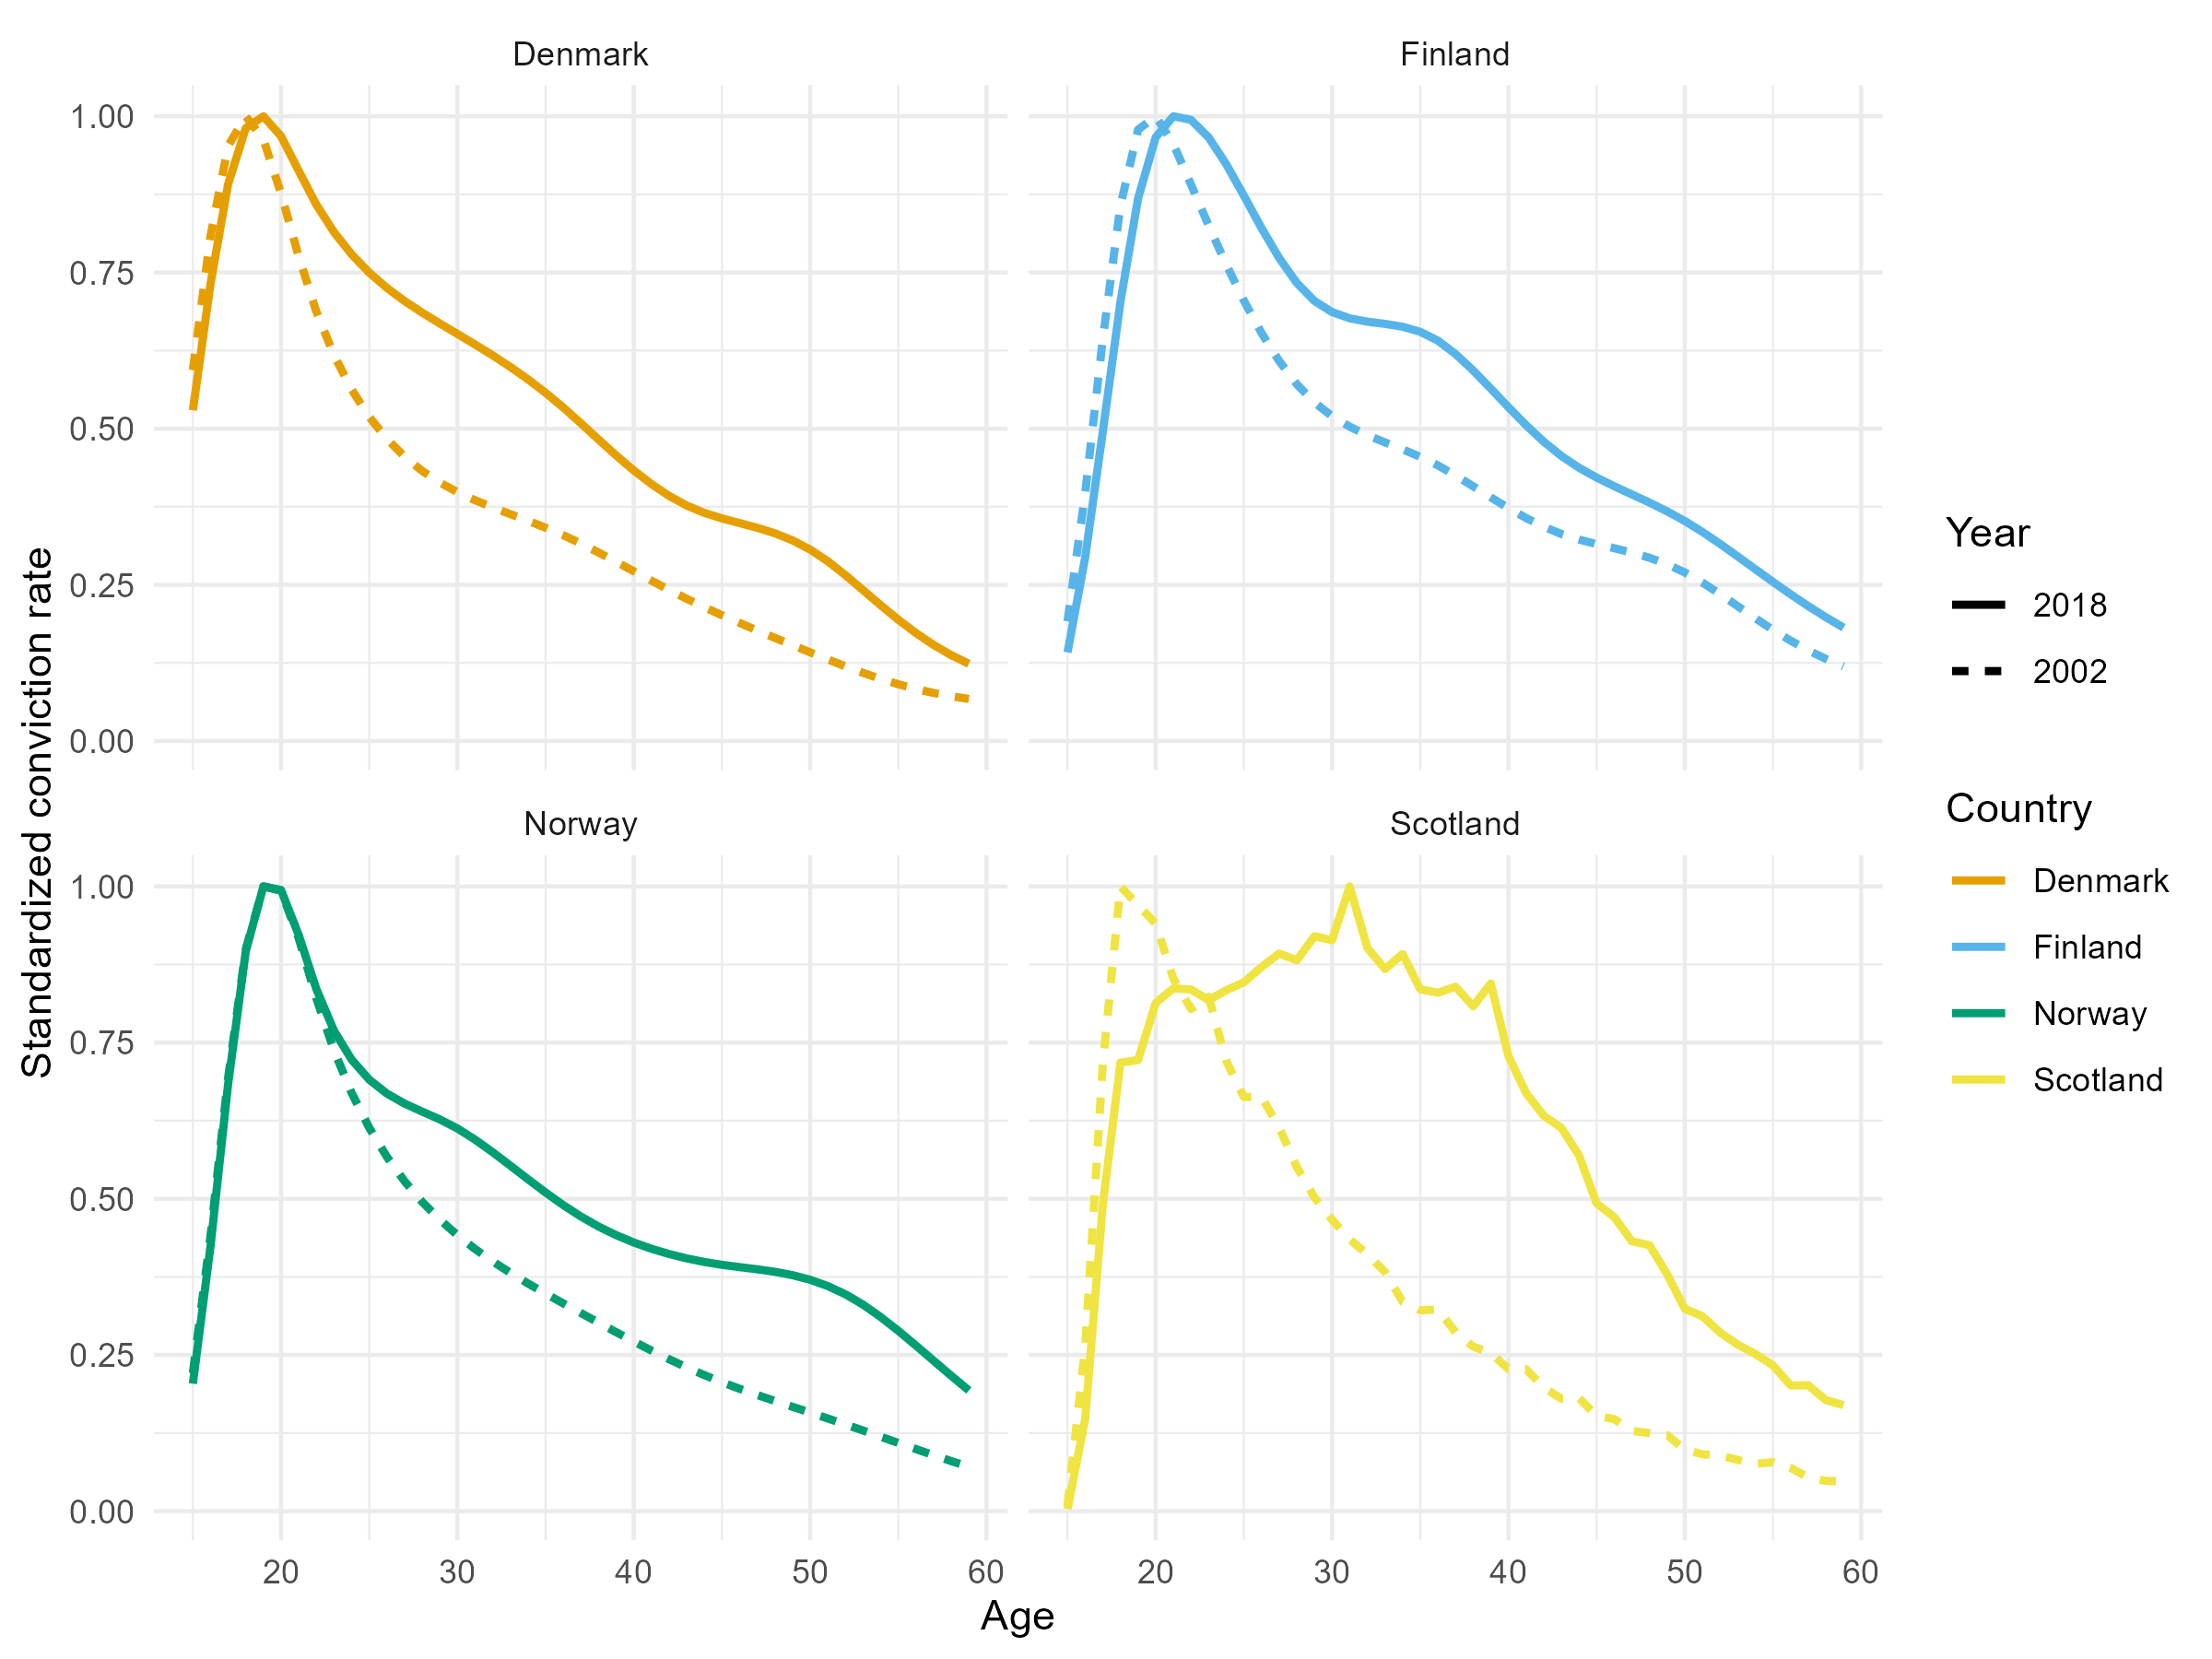
Change in standardized age-crime curves for selected years
Summary statistics
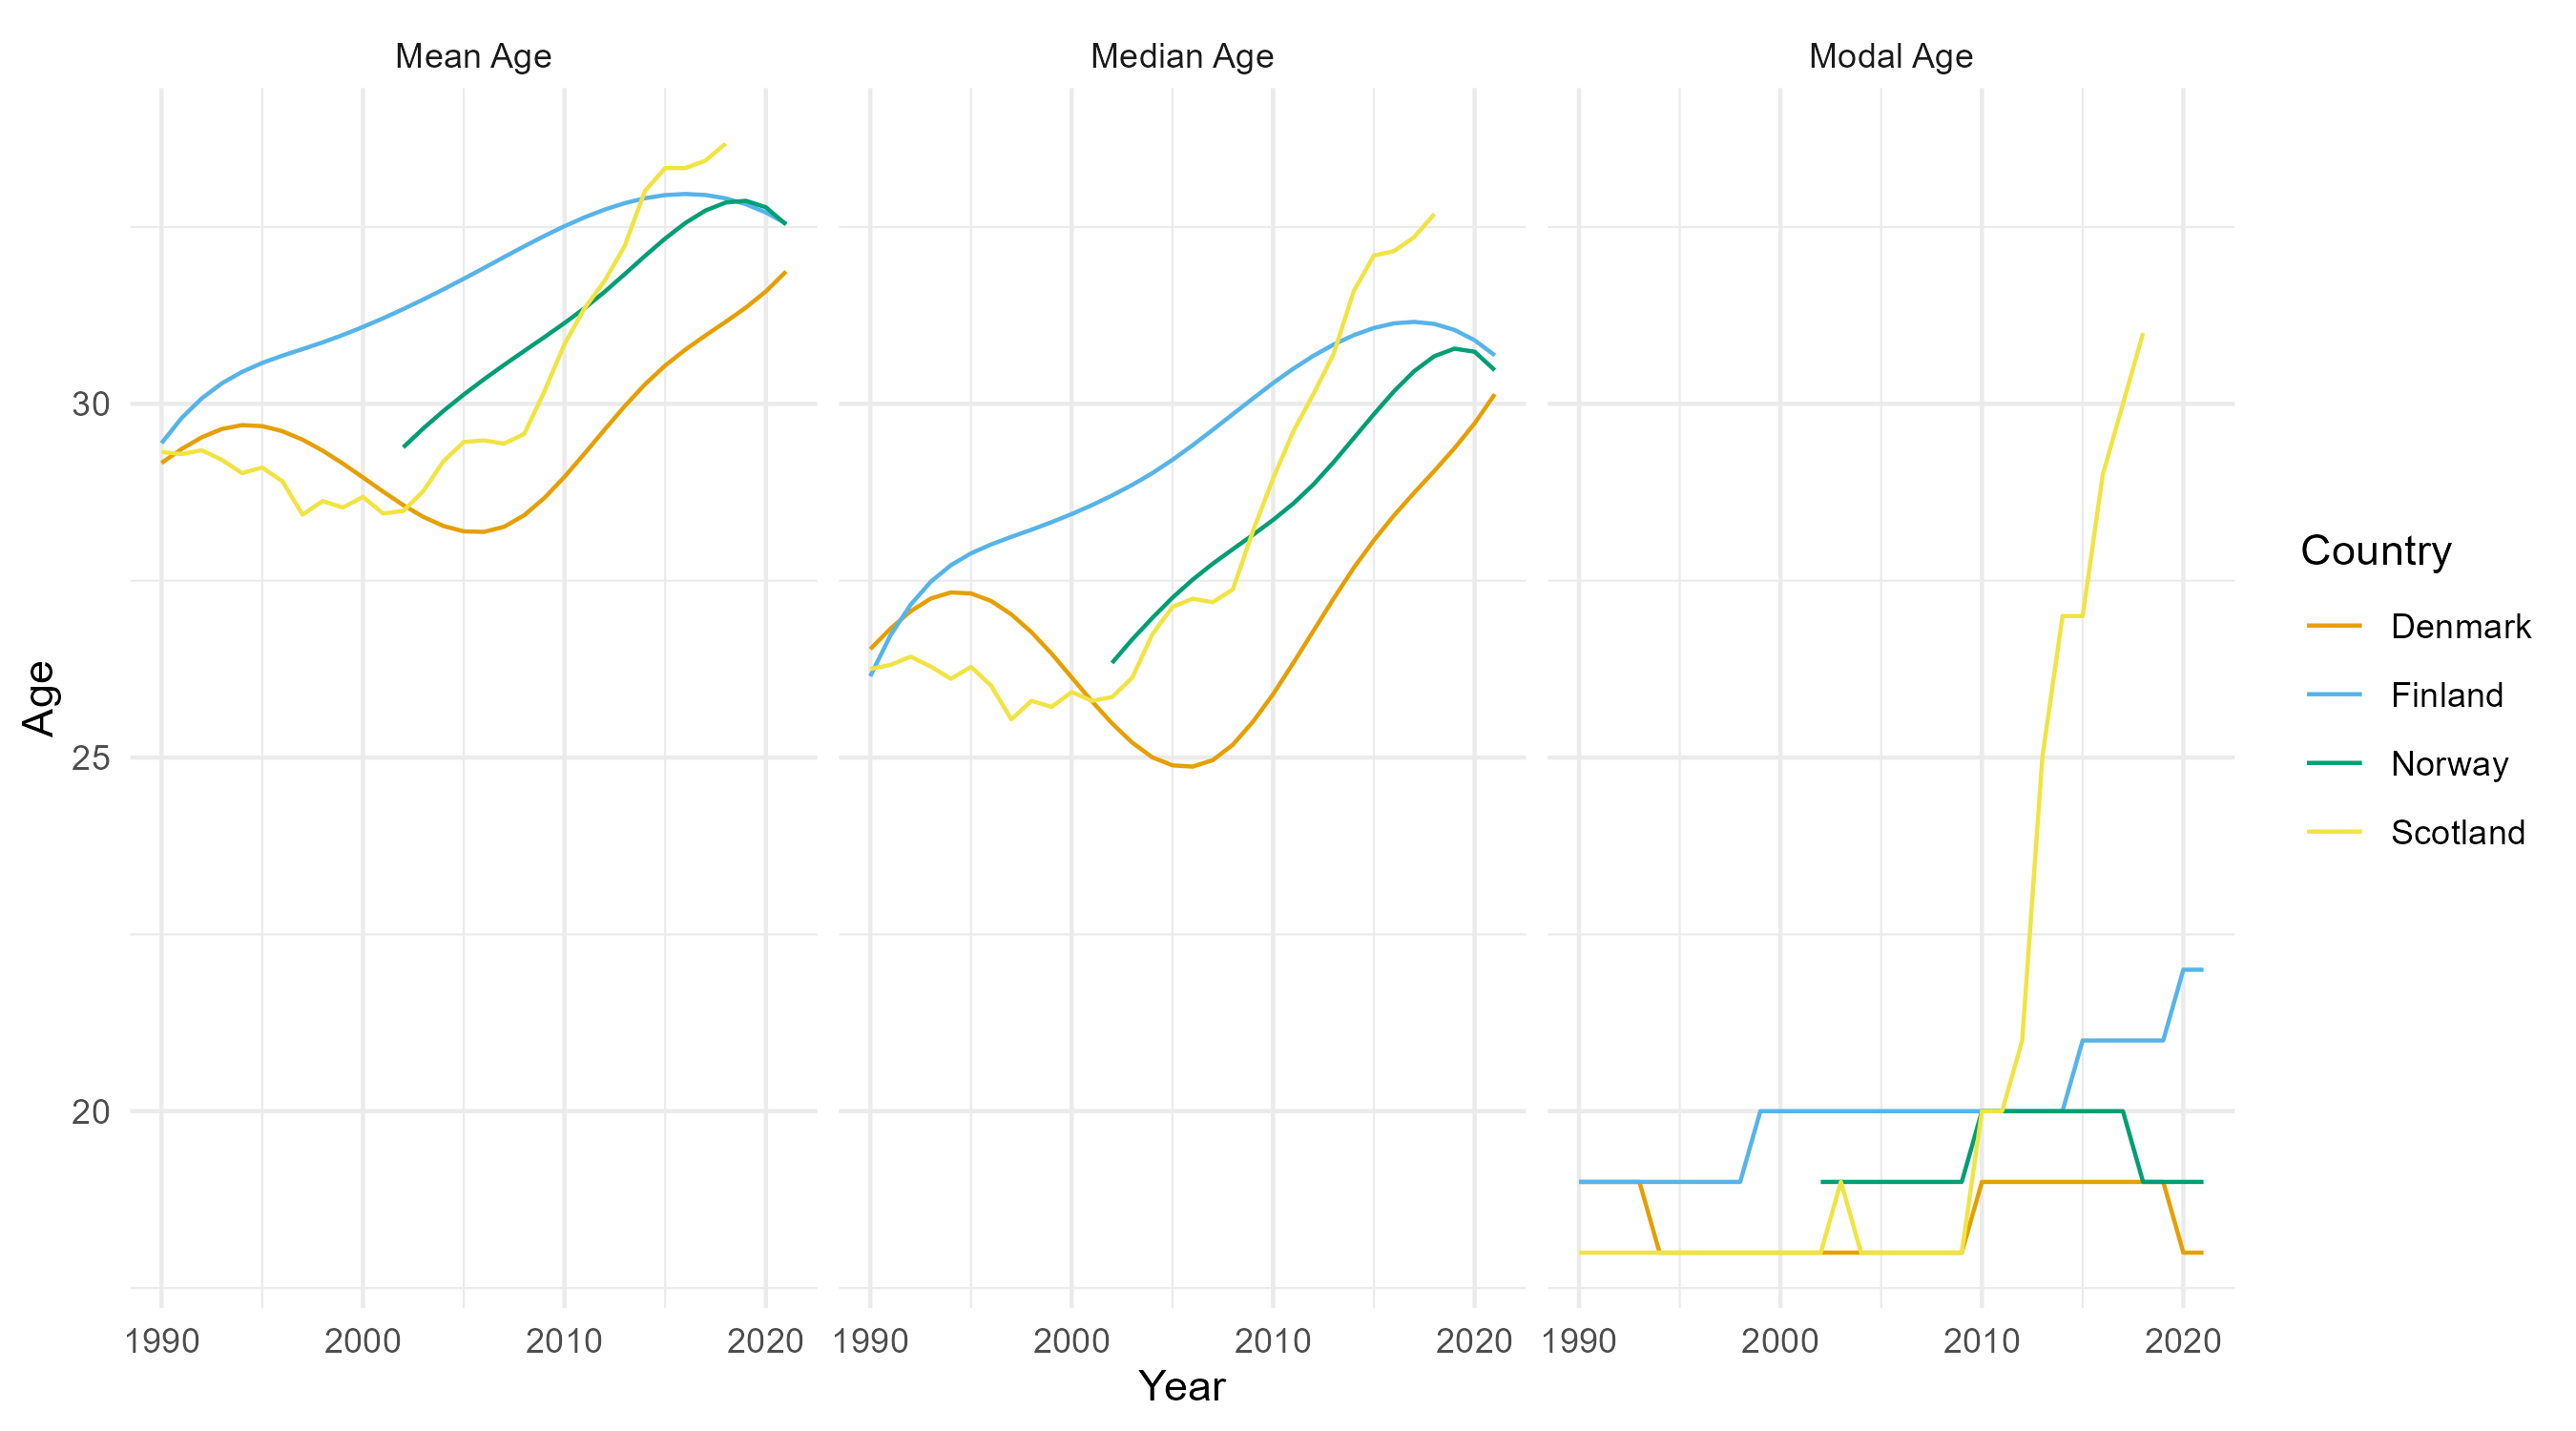
Summary statistics
Discussion
- The crime drop is (mostly?) a youth crime drop across the four countries
- And the timings of biggest falls in youth convictions (cohorts born around 1990ish) are pretty consistent across the four countries (roughly after 2005ish?)
Discussion
- But we don’t see the same fall in convictions for older people across countries - only really see the slight increases in convictions 30s-40s in Scotland
- Increases in convictions for people around age 50 seen in Norway and Denmark are similar to results from US arrest data as reported by Farrell, Laycock, and Tilley (2015)
- So perhaps this does fit better with a youth-focused explanation for the crime drop e.g. (Ball et al. 2023)
Discussion
- I’d say that three of the four countries showed pretty ‘classic’ annual age-crime curves throughout the period analysed, but one didn’t
- This is implies that there are pretty stark between country differences in how the age-crime curve has changed over time?
Where next?
- I think there are two directions this research could go in:
- This initial analysis raises lots of questions about… crime types, other demographics (gender, ethnicity, income… etc) that could be answered by more bespoke data
- Having done this analysis for (some of) Northern Europe, I think maybe an even more maximalist approach would be preferable - extending this comparison to anywhere that publishes data on age and conviction? (Though through some non-systematic Googling, there was data available for Switzerland, New Zealand and South Korea…)
Thank you!
Bonus content
Methods
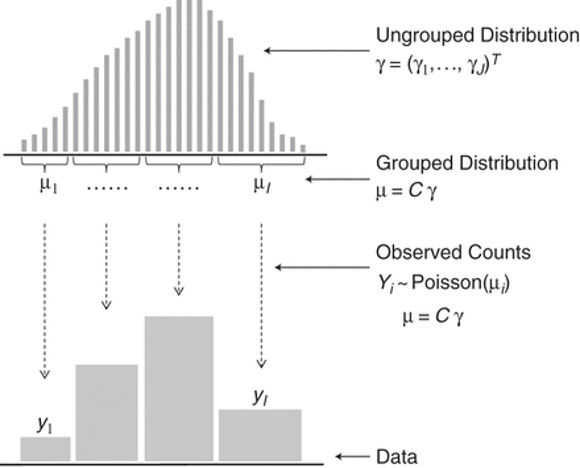
(Rizzi, Gampe, and Eilers 2015), Figure 1: Statistical model for grouped data
Modelling Assumptions
- Model makes some assumptions:
- “neighboring elements in γ do not differ drastically”
- “The smoothness assumption is implemented in a roughness penalty on the coefficients β”
- There is a penalty term λ and what the model does is pick the ‘best’ value of λ as determined by AIC
- This means that - in the frequentist setting - the final results are ‘optimal’ but you might be concerned about propagating uncertainty in λ through your analysis
Whence uncertainty estimates?
Because there’s a model in there there’s also uncertainty about the by-age-year predicted counts
You can get standard errors for your estimates/confidence intervals for the estimated conviction count/rate for each age in each year, but these seemed not to make much difference to the results from a quick look so I haven’t bothered here
This is because the age categories were coarse at older ages where there were also fewer convictions
What if I want to quantify how different age-crime surfaces are?
- I did look into ways of quantifying how different each country’s age-crime surface was (things like 2D generalizations of Kolmogorov-Smirnov tests and that sort of thing), to quantify how ‘similar’ the age-crime surfaces are
- Can frame this as either ‘how similar’ (continuous) or ‘are they statistically significantly different from each other’ (discrete)
- Problem is that the time series are different lengths (for methods like Kullback-Leibler divergence at least this is a problem)?
- Methods do exist but seem opaque to me - so I haven’t bothered (yet)
The lexis surface
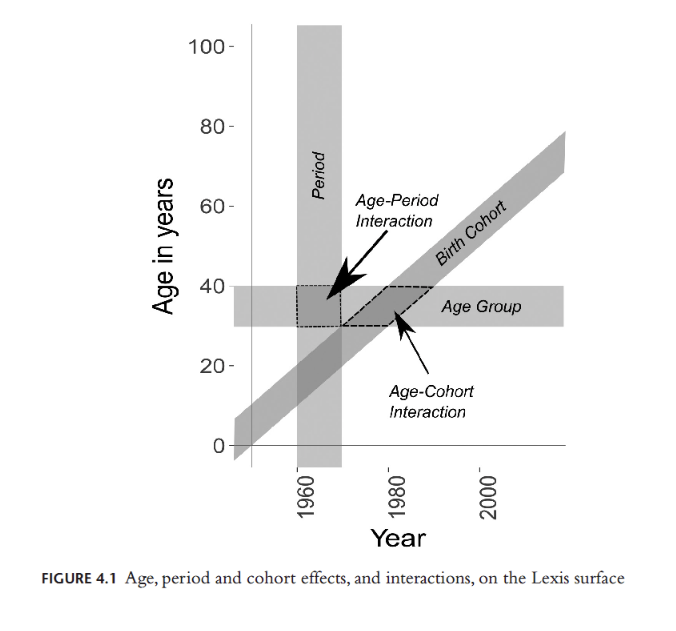
From Minton (2020)
Cohort results
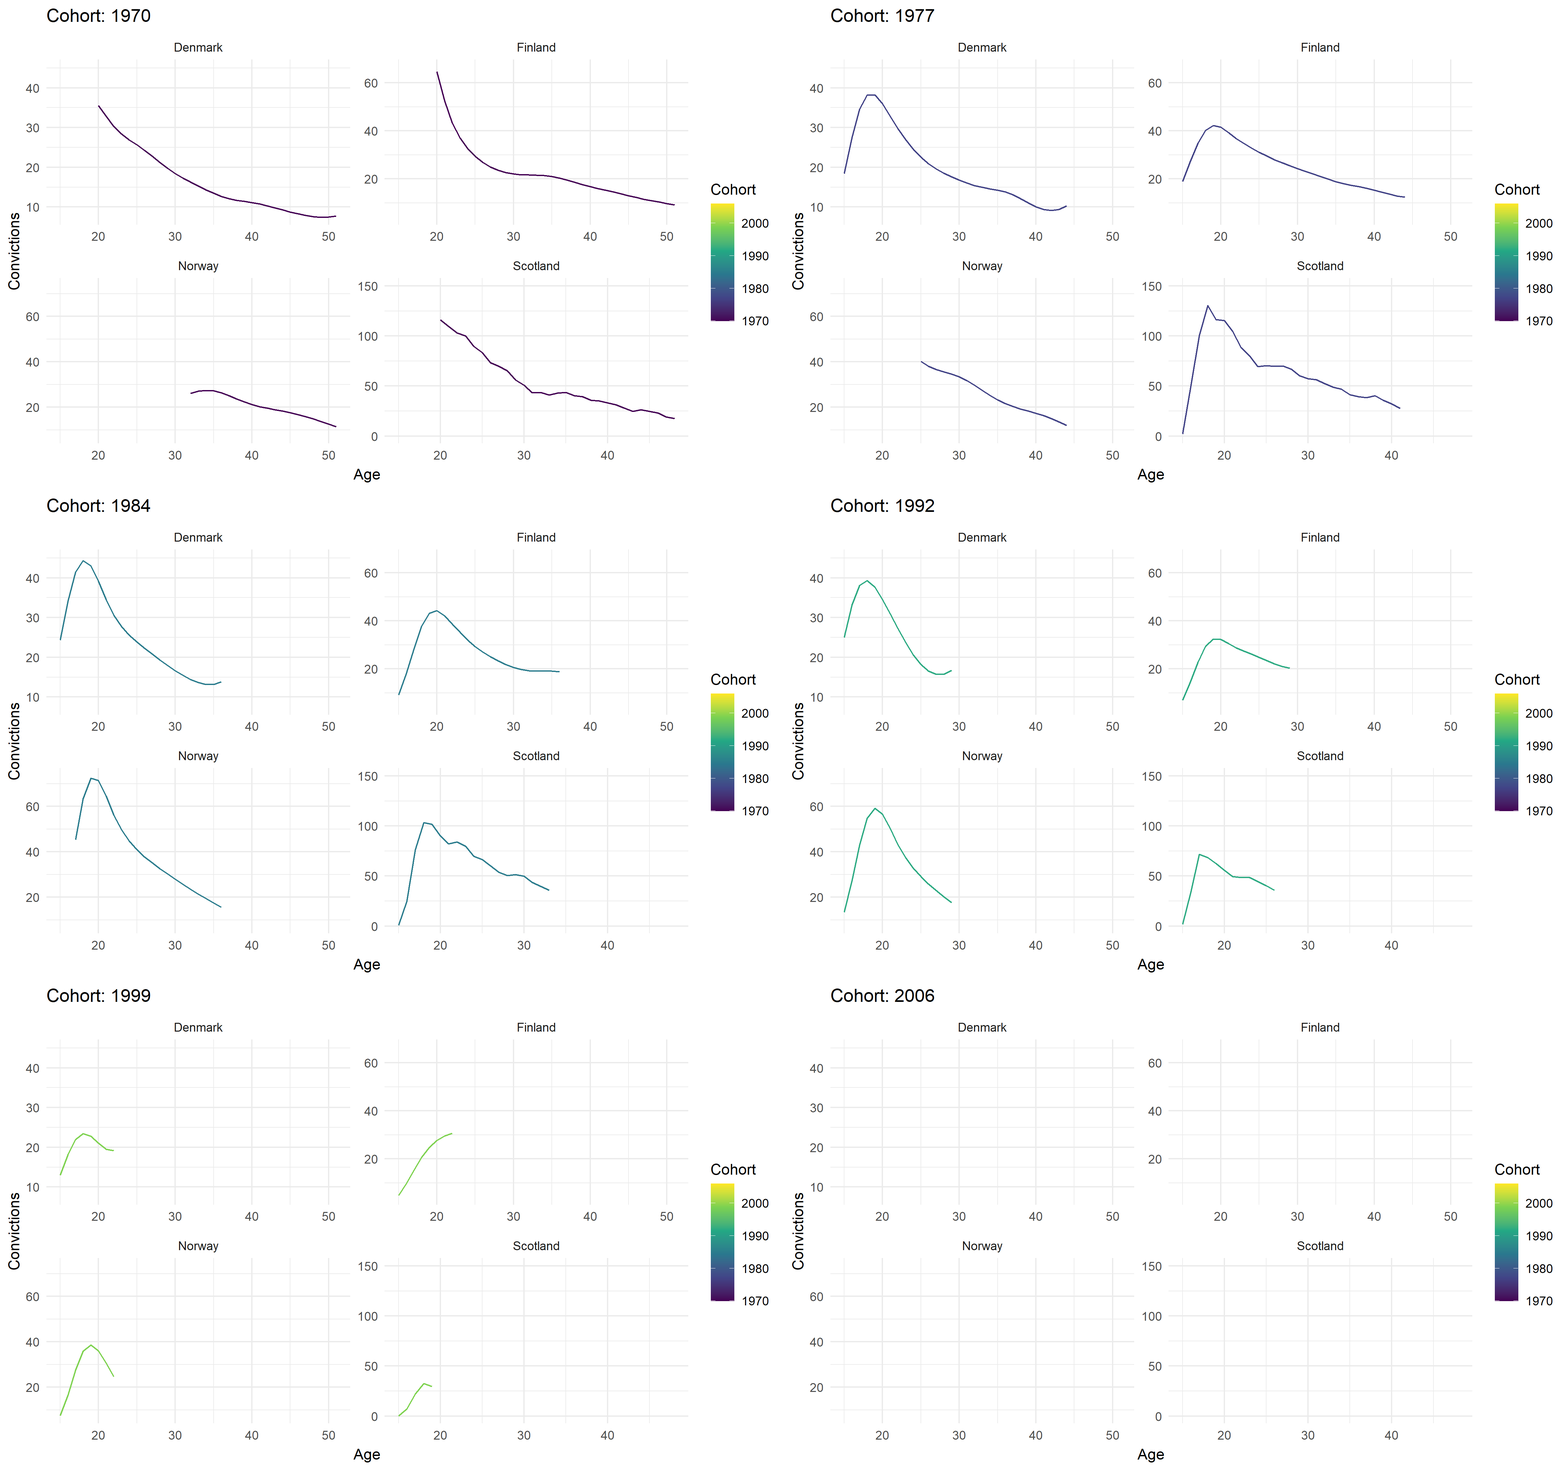
Change in cohort curves
Comparing countries 5
Change in age-indexed trends
Comparing countries 6
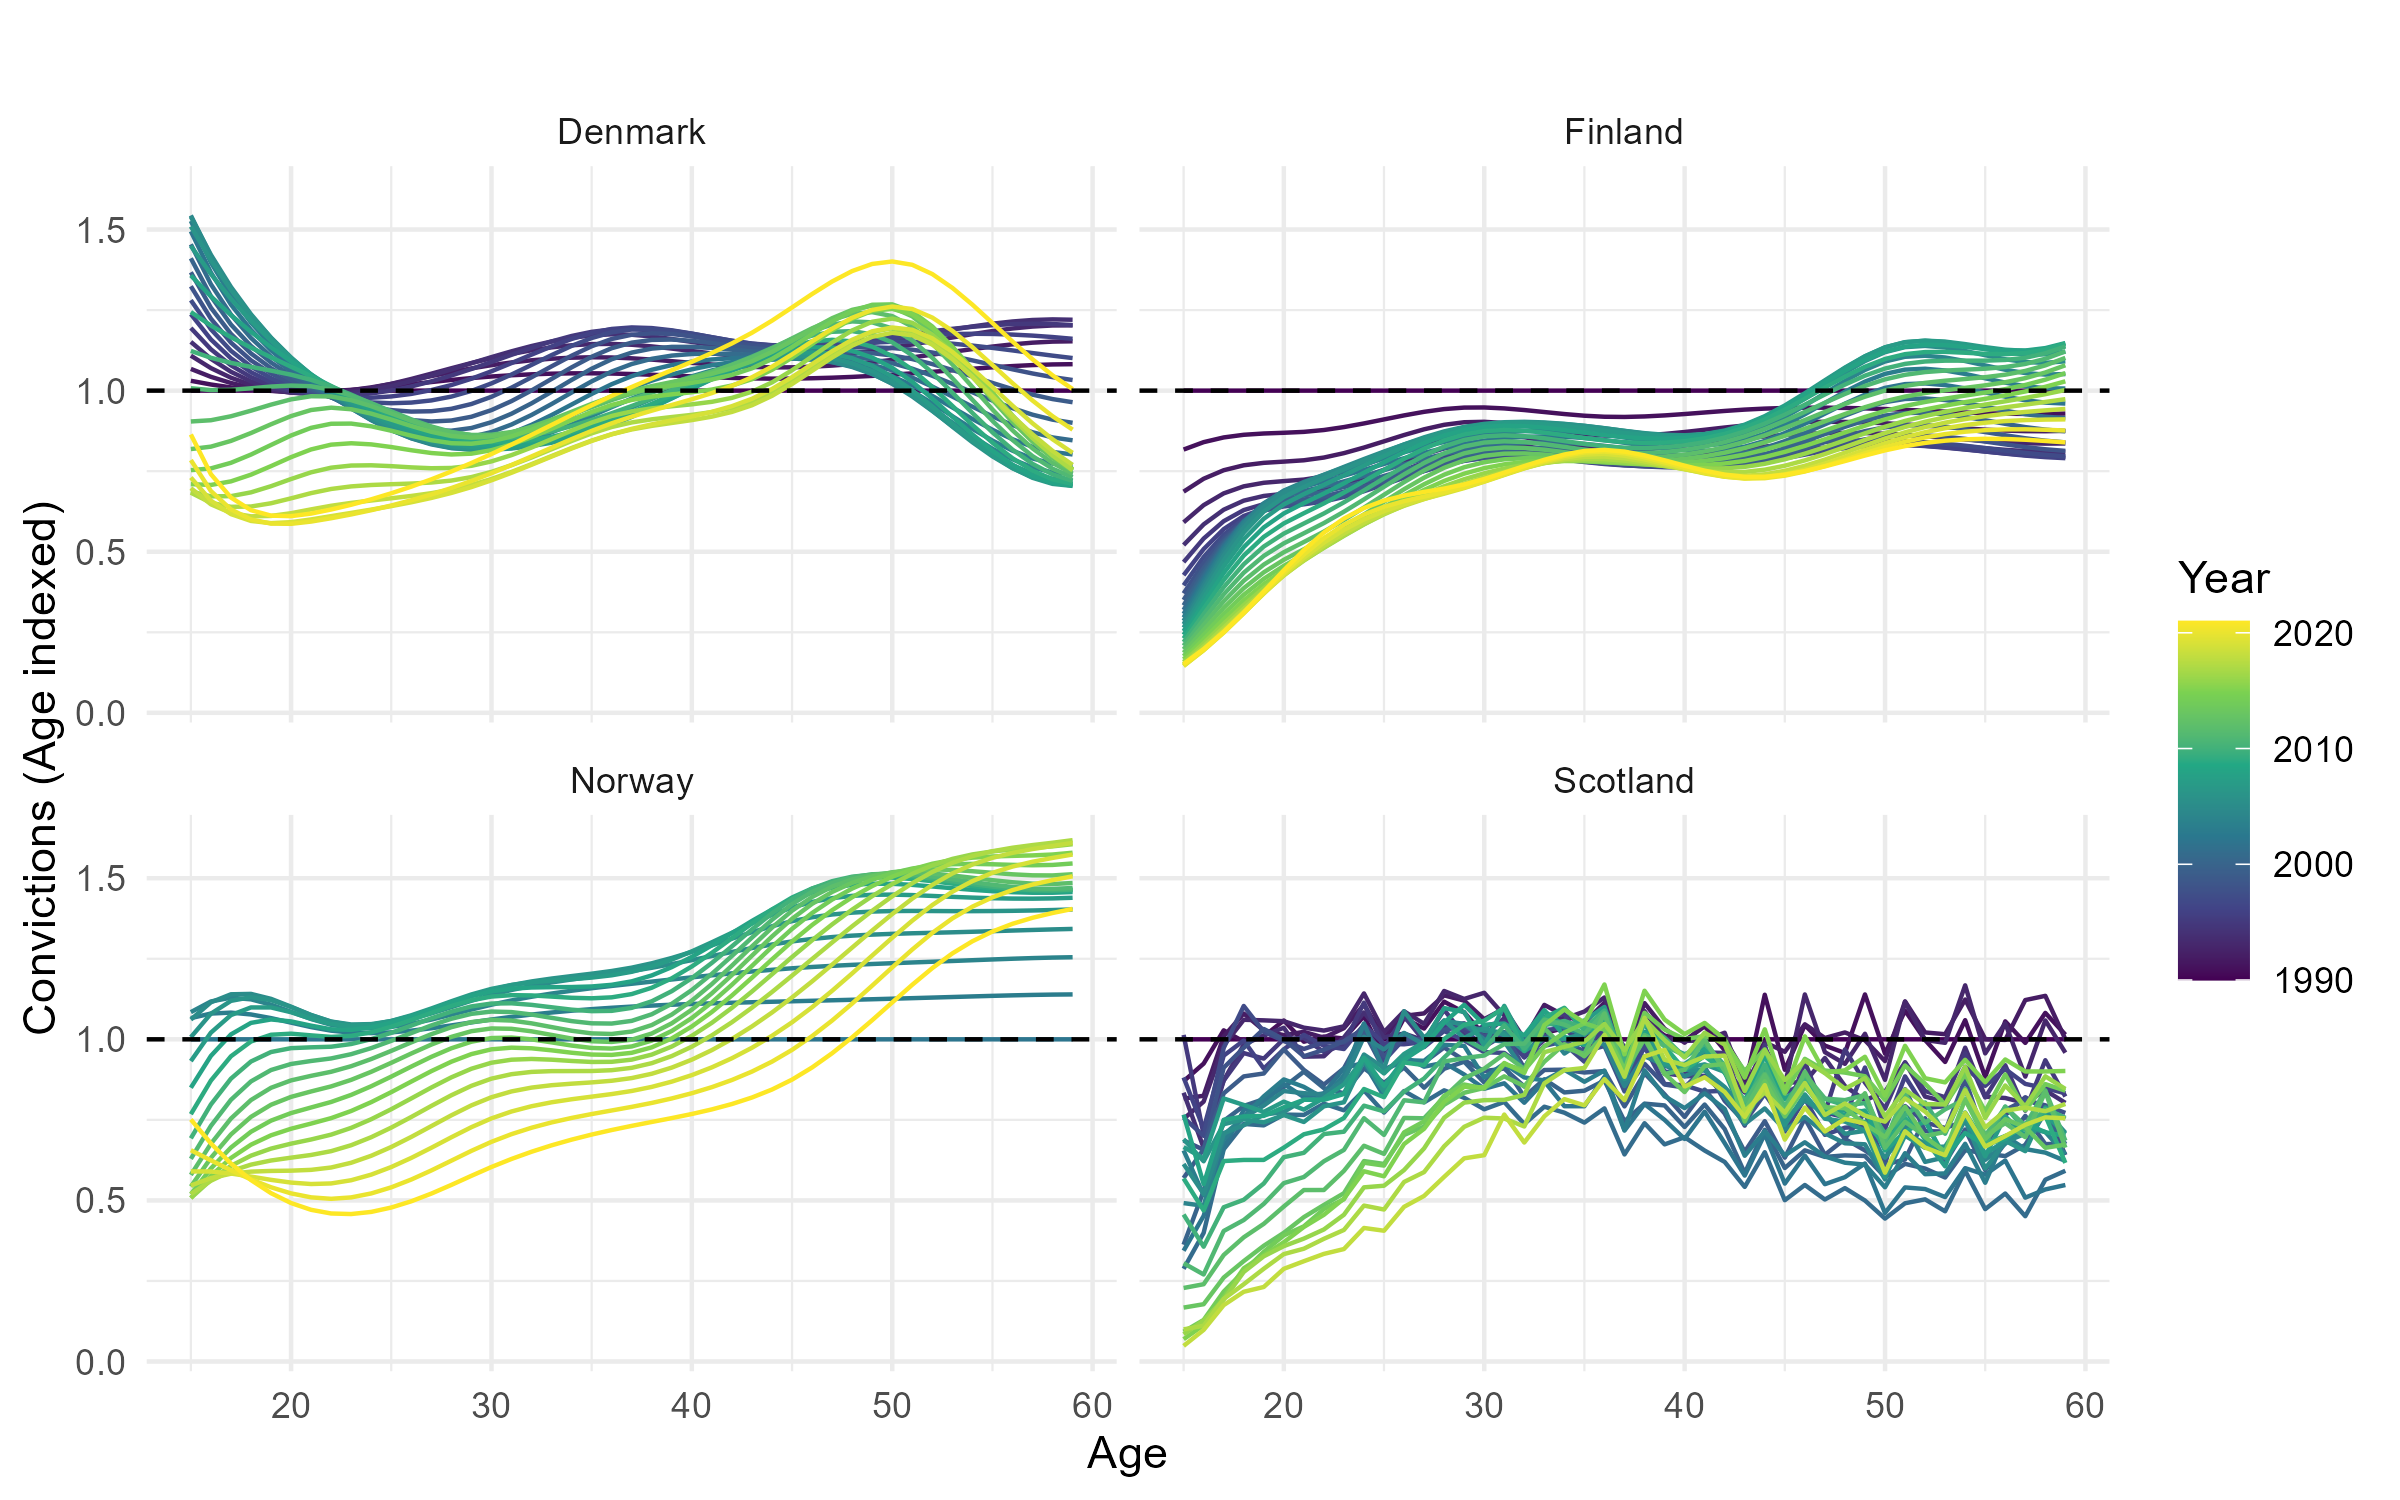
Change in age-indexed trend
Comparing countries 7
